
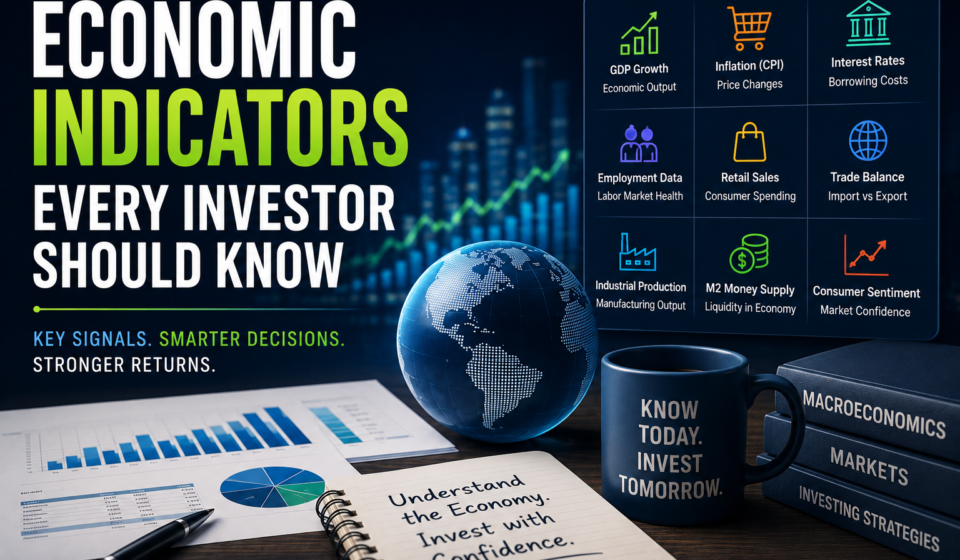

Economic indicators are statistics that provide information about the health and direction of an economy. Investors use them to understand economic conditions, evaluate market trends, and make more informed investment decisions.
Indicators can provide clues about economic growth, inflation, employment, consumer activity, business conditions, and interest rates. No single indicator can explain everything happening in an economy, so investors often examine several indicators together.
Understanding these measurements can help investors put market movements into context and recognize how economic conditions may affect different asset classes.
What Are Economic Indicators?
Economic indicators are data points or statistics that help describe economic activity.
Governments, central banks, research organizations, and private institutions publish different types of economic data.
Investors may use this information to assess:
- Economic growth
- Inflation
- Employment
- Consumer spending
- Business activity
- Interest rates
- Housing conditions
- Manufacturing activity
- International trade
- Financial market conditions
Economic indicators can influence investor expectations and market sentiment.
Why Are Economic Indicators Important?
Financial markets respond not only to current economic conditions but also to expectations about the future.
If economic data is significantly stronger or weaker than expected, investors may adjust their expectations for interest rates, corporate earnings, and economic growth.
For example, unexpectedly high inflation may increase concerns about higher interest rates.
Similarly, unexpectedly weak employment data may increase expectations that policymakers could consider supporting economic activity.
Leading, Lagging, and Coincident Indicators
Economic indicators are often grouped into three categories.
Leading Indicators
Leading indicators may provide clues about future economic activity.
Examples include:
- Consumer confidence
- Building permits
- New orders
- Stock market trends
- Manufacturing expectations
Lagging Indicators
Lagging indicators tend to confirm economic conditions after they have already developed.
Examples include:
- Unemployment duration
- Certain labor cost measures
- Some corporate earnings measures
Coincident Indicators
Coincident indicators move relatively closely with current economic conditions.
Examples include:
- Industrial production
- Personal income
- Employment levels
- Retail sales
Understanding these categories can help investors interpret economic data more effectively.
Gross Domestic Product
Gross Domestic Product, commonly called GDP, measures the value of goods and services produced within an economy during a specific period.
GDP is one of the most widely followed measures of economic activity.
Rising GDP can indicate economic expansion, while declining GDP may indicate weaker economic activity.
Investors often examine both the overall GDP figure and its components.
GDP Growth Rate
The GDP growth rate shows how quickly economic output is increasing or decreasing.
Strong economic growth can support corporate revenue and earnings, although exceptionally strong growth can also contribute to inflationary pressure.
Weak growth may create challenges for businesses and increase concerns about recession.
Consumer Price Index
The Consumer Price Index, commonly known as CPI, measures changes in the prices consumers pay for a basket of goods and services.
It is an important inflation indicator.
Investors closely monitor CPI because inflation can influence:
- Interest rates
- Consumer spending
- Corporate costs
- Bond prices
- Stock valuations
- Currency values
Core Inflation
Core inflation generally excludes certain volatile categories from the inflation calculation.
The goal is to provide a clearer view of underlying price trends.
Investors may examine both overall inflation and core inflation when evaluating economic conditions.
Producer Price Index
The Producer Price Index, or PPI, measures changes in prices received by producers for goods and services.
PPI can provide information about price pressures earlier in the production process.
Rising producer prices can sometimes contribute to higher consumer prices if businesses pass increased costs to customers.
Unemployment Rate
The unemployment rate measures the percentage of the labor force that is unemployed and actively seeking work.
A low unemployment rate generally indicates a strong labor market.
A rising unemployment rate may signal weakening economic conditions.
However, unemployment data should be evaluated alongside other labor market indicators.
Nonfarm Payrolls
Nonfarm payrolls measure changes in employment across many sectors of the economy, excluding certain categories such as agricultural workers and some government and private positions.
The monthly employment report is closely followed by investors because employment conditions can influence consumer spending, economic growth, and monetary policy expectations.
Jobless Claims
Jobless claims provide information about the number of people filing for unemployment benefits.
Weekly jobless claims can provide a more frequent view of labor market conditions than monthly employment reports.
Rising claims may indicate increasing layoffs or weakening employment conditions.
Wage Growth
Wage growth measures changes in employee compensation.
Rising wages can support consumer spending.
However, rapid wage growth can also contribute to inflation if businesses increase prices to offset higher labor costs.
Investors therefore consider wage growth in relation to productivity and broader inflation trends.
Retail Sales
Retail sales measure consumer spending at retailers.
Consumer spending is an important part of many economies.
Strong retail sales can indicate healthy consumer demand.
Weak retail sales may suggest that consumers are becoming more cautious.
Retail sales can influence expectations for corporate revenue, especially for consumer focused companies.
Consumer Confidence
Consumer confidence measures how optimistic or pessimistic households are about economic conditions.
Confident consumers may be more willing to spend money on large purchases.
Lower confidence can encourage households to save more and reduce discretionary spending.
Consumer Sentiment
Consumer sentiment surveys measure household attitudes toward current and future economic conditions.
Investors may use sentiment data as an indication of potential changes in consumer spending.
However, sentiment does not always translate directly into actual spending behavior.
Purchasing Managers Index
The Purchasing Managers Index, or PMI, is a widely followed measure of business activity.
Separate surveys can cover manufacturing and services.
A reading above a commonly used threshold may indicate expansion, while a reading below it may indicate contraction.
PMI data can provide an early view of business conditions.
Manufacturing Activity
Manufacturing indicators provide information about industrial production and factory activity.
Manufacturing data can be particularly important for economies with large industrial sectors.
Changes in new orders, production, inventories, and employment can provide clues about future economic activity.
Industrial Production
Industrial production measures output from sectors such as manufacturing, mining, and utilities.
Increasing industrial production can indicate stronger economic activity.
Declining production may suggest weaker demand or challenging business conditions.
Housing Starts
Housing starts measure the beginning of construction on new residential buildings.
Housing activity can provide information about:
- Consumer demand
- Construction activity
- Employment
- Mortgage conditions
- Material demand
Housing is also sensitive to interest rates.
Building Permits
Building permits indicate the number of permits issued for new construction.
Because permits generally occur before construction begins, they can provide clues about future housing activity.
Existing Home Sales
Existing home sales measure transactions involving previously owned homes.
Housing sales can be influenced by mortgage rates, household income, consumer confidence, housing supply, and economic conditions.
New Home Sales
New home sales measure sales of newly constructed residential properties.
They can provide information about housing demand and construction activity.
Interest Rates
Interest rates are among the most important economic factors for investors.
Higher interest rates can increase borrowing costs for consumers and businesses.
They can also influence:
- Bond prices
- Stock valuations
- Real estate
- Currency markets
- Consumer spending
- Business investment
Central Bank Policy Rate
Central banks use policy rates as a major tool for influencing economic conditions.
When inflation is high, a central bank may raise rates to reduce demand and price pressures.
When economic activity is weak, a central bank may lower rates to encourage borrowing and spending.
The exact policy framework differs between countries.
Inflation Expectations
Inflation expectations reflect what consumers, businesses, and investors believe will happen to prices in the future.
Expectations matter because they can influence wages, spending, investment decisions, and monetary policy.
Persistent increases in inflation expectations can create additional challenges for policymakers.
Bond Yields
Bond yields indicate the return investors demand from bonds.
Government bond yields are closely monitored because they influence borrowing costs across the economy.
Changes in bond yields can affect stock valuations, mortgage rates, corporate borrowing costs, and currency markets.
Yield Curve
The yield curve shows interest rates across different bond maturities.
A typical yield curve may slope upward, meaning longer term bonds have higher yields than shorter term bonds.
Changes in the shape of the yield curve can provide information about investor expectations for growth, inflation, and interest rates.
Consumer Credit
Consumer credit data provides information about household borrowing.
Rising borrowing can support spending but may also increase household debt burdens.
Declining borrowing may indicate greater caution among consumers.
Personal Income
Personal income measures income received by individuals.
Higher income can support consumer spending and saving.
Investors can examine income alongside consumer spending to determine whether spending growth is supported by household financial conditions.
Personal Consumption Expenditures
Personal Consumption Expenditures, or PCE, measure consumer spending on goods and services.
The PCE price index is closely watched by policymakers in some economies as an important inflation measure.
Business Inventories
Business inventory data measures stocks of goods held by companies.
Rising inventories can indicate that businesses are preparing for stronger demand.
However, rapidly rising inventories can also indicate that products are not selling as expected.
Corporate Earnings
Corporate earnings are not traditionally classified as broad economic indicators, but they are extremely important to investors.
Company earnings provide information about:
- Revenue
- Profitability
- Costs
- Demand
- Margins
- Business expectations
Economic conditions can have a direct impact on corporate earnings.
Trade Balance
The trade balance measures the difference between a country’s exports and imports.
A trade surplus occurs when exports exceed imports.
A trade deficit occurs when imports exceed exports.
Trade data can provide insight into economic activity, currency demand, and international competitiveness.
Current Account
The current account measures international transactions involving goods, services, income, and transfers.
It provides a broader view of a country’s economic relationship with the rest of the world.
Currency Exchange Rates
Currency values can affect investors and businesses with international exposure.
A stronger currency can make imports cheaper but can reduce the value of overseas earnings when converted back into the domestic currency.
A weaker currency can have the opposite effect.
Commodity Prices
Commodity prices can influence inflation and corporate profitability.
Important commodities include:
- Oil
- Natural gas
- Gold
- Copper
- Agricultural products
Energy prices can have particularly broad economic effects because energy is used throughout many industries.
Oil Prices
Oil prices can influence transportation costs, production expenses, inflation, and consumer spending.
Higher oil prices can benefit energy producers but increase costs for businesses and consumers.
Lower oil prices can reduce costs for many industries while potentially hurting energy companies.
Gold Prices
Gold is often monitored as a potential store of value and as an asset influenced by inflation expectations, interest rates, currency movements, and investor sentiment.
Gold prices can respond to economic uncertainty, although the relationship is not always straightforward.
Financial Market Indicators
Investors also monitor financial market indicators such as:
- Stock indexes
- Bond yields
- Credit spreads
- Volatility measures
- Currency indexes
- Commodity prices
These indicators can provide information about investor expectations and market risk appetite.
Volatility Indexes
Volatility indexes are designed to measure expected market volatility based on options pricing.
Higher volatility readings can indicate increased uncertainty or demand for protection.
Lower readings may indicate calmer market conditions.
Volatility measurements do not necessarily predict whether markets will rise or fall.
Credit Spreads
Credit spreads measure the difference between yields on different types of debt.
For example, the spread between corporate bonds and government bonds can provide information about perceived credit risk.
Widening spreads can indicate increasing concerns about economic or financial conditions.
How Investors Should Use Economic Indicators
Investors should avoid relying on a single economic statistic.
A better approach is to examine several indicators together.
For example, an investor studying economic growth might consider:
- GDP growth
- Employment
- Retail sales
- Industrial production
- Consumer confidence
- Corporate earnings
For inflation, investors might examine:
- CPI
- PCE
- PPI
- Wage growth
- Commodity prices
- Inflation expectations
Looking at several data points can provide a broader picture.
Why Market Expectations Matter
Markets often react to the difference between actual economic data and what investors expected.
Suppose investors expect inflation to fall but the latest report shows inflation increasing.
The market reaction may be significant because investors may change their expectations about future interest rates.
This means investors should consider both the economic data and the market’s existing expectations.
Economic Indicators and Different Investments
Different asset classes can respond differently to economic conditions.
Stocks
Stocks can be influenced by economic growth, corporate earnings, inflation, interest rates, and consumer spending.
Bonds
Bonds are particularly sensitive to interest rates, inflation expectations, and credit conditions.
Real Estate
Real estate can be affected by mortgage rates, employment, income, housing supply, and economic growth.
Commodities
Commodities are influenced by supply, demand, economic activity, inflation, weather, and geopolitical conditions.
Currencies
Currencies can respond to interest rate differences, economic growth, inflation, trade conditions, and investor sentiment.
Common Mistakes When Reading Economic Data
Focusing on One Indicator
One data point rarely explains the entire economy.
Ignoring Revisions
Economic data can be revised after initial publication.
Ignoring Expectations
Markets often respond to differences between expected and actual results.
Confusing Correlation With Causation
Two indicators moving together does not necessarily mean one causes the other.
Overreacting to Short Term Data
Economic trends often develop over months or years.
Ignoring the Broader Environment
The same indicator can have different implications depending on monetary policy, market valuations, and global conditions.
How Beginners Can Start Tracking Economic Indicators
Beginners do not need to follow every economic report.
Start with a small group of major indicators:
- GDP growth
- Inflation
- Unemployment
- Interest rates
- Retail sales
- Consumer confidence
- Manufacturing activity
- Bond yields
- Corporate earnings
- Housing activity
Over time, investors can add more indicators depending on their investment strategy.
Final Thoughts
Economic indicators provide valuable information about the condition of an economy and can help investors understand why markets may be changing.
GDP can provide insight into economic growth. Inflation indicators can reveal price pressures. Employment data can show labor market strength. Retail sales can provide clues about consumer demand, while interest rates and bond yields can influence borrowing costs and asset valuations.
The most effective approach is to look at several indicators together rather than treating any single statistic as a complete picture.
Economic data can inform investment decisions, but it cannot predict market movements with certainty. Investors should combine economic analysis with an understanding of valuations, portfolio diversification, risk tolerance, and long term financial goals.
Frequently Asked Questions
What are economic indicators?
Economic indicators are statistics that provide information about economic conditions, activity, growth, inflation, employment, and other aspects of an economy.
Why are economic indicators important to investors?
They can help investors understand economic trends and assess how changing conditions may affect investments.
What is the most important economic indicator?
There is no single most important indicator. GDP, inflation, employment, interest rates, consumer spending, and other data points provide different types of information.
What is GDP?
GDP measures the value of goods and services produced within an economy during a specific period.
What does GDP growth indicate?
GDP growth generally indicates that economic output is increasing, while declining GDP may indicate weaker economic activity.
What is CPI?
CPI, or Consumer Price Index, measures changes in prices paid by consumers for a basket of goods and services.
What is inflation?
Inflation refers to a general increase in the prices of goods and services over time.
Why does inflation matter to investors?
Inflation can affect interest rates, purchasing power, corporate costs, consumer spending, bond prices, and investment valuations.
What is the unemployment rate?
The unemployment rate measures the percentage of the labor force that is unemployed and actively seeking work.
What is the PMI?
The Purchasing Managers Index is a survey based measure of business activity that can provide information about manufacturing and services conditions.
What is a leading economic indicator?
A leading indicator may provide clues about future economic activity before changes become visible in broader economic data.
What is a lagging indicator?
A lagging indicator generally confirms economic conditions after those conditions have already developed.
What is a coincident indicator?
A coincident indicator tends to move relatively closely with current economic conditions.
Why are interest rates important?
Interest rates affect borrowing costs, saving decisions, bond prices, business investment, consumer spending, and asset valuations.
What is the yield curve?
The yield curve shows interest rates for bonds with different maturities.
Why do investors monitor bond yields?
Bond yields can provide information about interest rates, inflation expectations, economic growth, and perceived risk.
What is consumer confidence?
Consumer confidence measures how optimistic or pessimistic households are about economic conditions.
Why is retail sales data important?
Retail sales provide information about consumer spending, which is an important component of economic activity.
What is PPI?
PPI, or Producer Price Index, measures changes in prices received by producers and can provide information about price pressures earlier in the supply chain.
What is wage growth?
Wage growth measures changes in employee compensation and can influence consumer spending and inflation.
What is industrial production?
Industrial production measures output from sectors such as manufacturing, mining, and utilities.
What are housing starts?
Housing starts measure the beginning of construction on new residential properties.
Why do investors monitor oil prices?
Oil prices can influence inflation, transportation costs, production expenses, consumer spending, and energy company profits.
What are credit spreads?
Credit spreads measure differences in yields between debt securities with different levels of credit risk.
Why do market expectations matter?
Financial markets often react to whether economic data is stronger or weaker than investors expected.
Should investors follow every economic report?
No. Beginners can focus on major indicators that are relevant to their investment strategy.
Can economic indicators predict stock prices?
Economic indicators can provide useful information about economic conditions, but they cannot reliably predict future stock prices.
How often are economic indicators released?
Different indicators are released at different frequencies. Some are published weekly, while others are released monthly, quarterly, or annually.
Can economic data be revised?
Yes. Initial economic estimates can be revised as additional information becomes available.
What economic indicators should beginners follow?
A useful starting group includes GDP growth, inflation, unemployment, interest rates, retail sales, consumer confidence, manufacturing activity, bond yields, and housing data.
Do economic indicators affect all investments equally?
No. Different asset classes and industries can respond differently to economic conditions.
What is the best way to use economic indicators?
Use several indicators together, compare current data with previous periods and expectations, and consider the broader economic and financial environment rather than relying on one statistic.


